

Americans love to drive. Many Americans seem to relish the classic summer road trip. It is natural to seek the scenic highways, cool roadside attractions, and highway diner menus across the country. Americans even invented the tailgate just to party across the nation's vast parking lots.
While they love to drive, Americans do not have a great track record at staying safe on the roads. The post-pandemic years have been particularly bad, with elevated levels of traffic-related fatalities. Compared with the pre-pandemic average (2017-2019), there have been at least 11% more road deaths in the U.S. in each of the last three years.
Motointegrator and the research experts at DataPulse Research teamed up to determine how many of those deaths involved bad driving behavior—and where they occurred.
By querying databases managed by the National Highway Traffic Safety Administration, Motointegrator extracted the characteristics of the 2022 road deaths (the most recent year for which data are available) for every state and Washington, D.C., and looked at the share of deaths in each state that are tied to four dangerous driving behaviors:
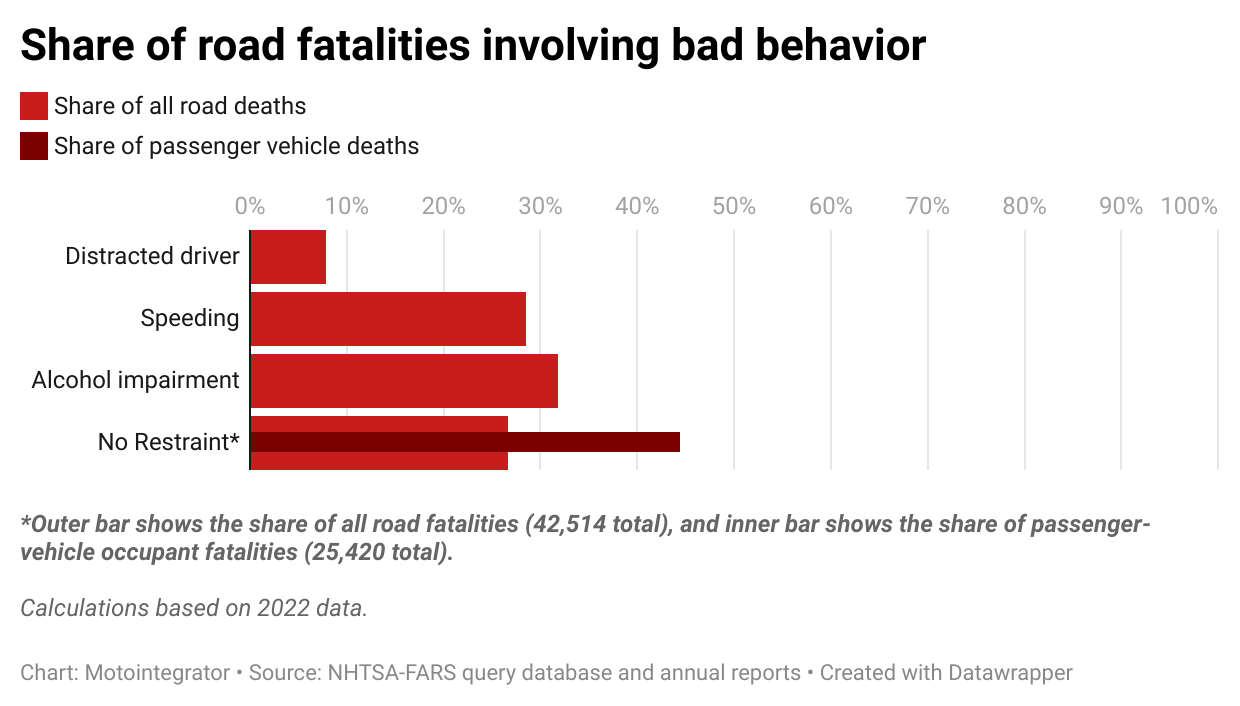
The analysis first examined bad driving behaviors at the national level by calculating the number and percentage of deaths attributed to each behavior. These include seatbelt disuse, speeding, alcohol impairment, and distracted driving.
The findings are similar for speeding, alcohol impairment, and seatbelt disuse. All four behaviors were found to be significantly lethal.
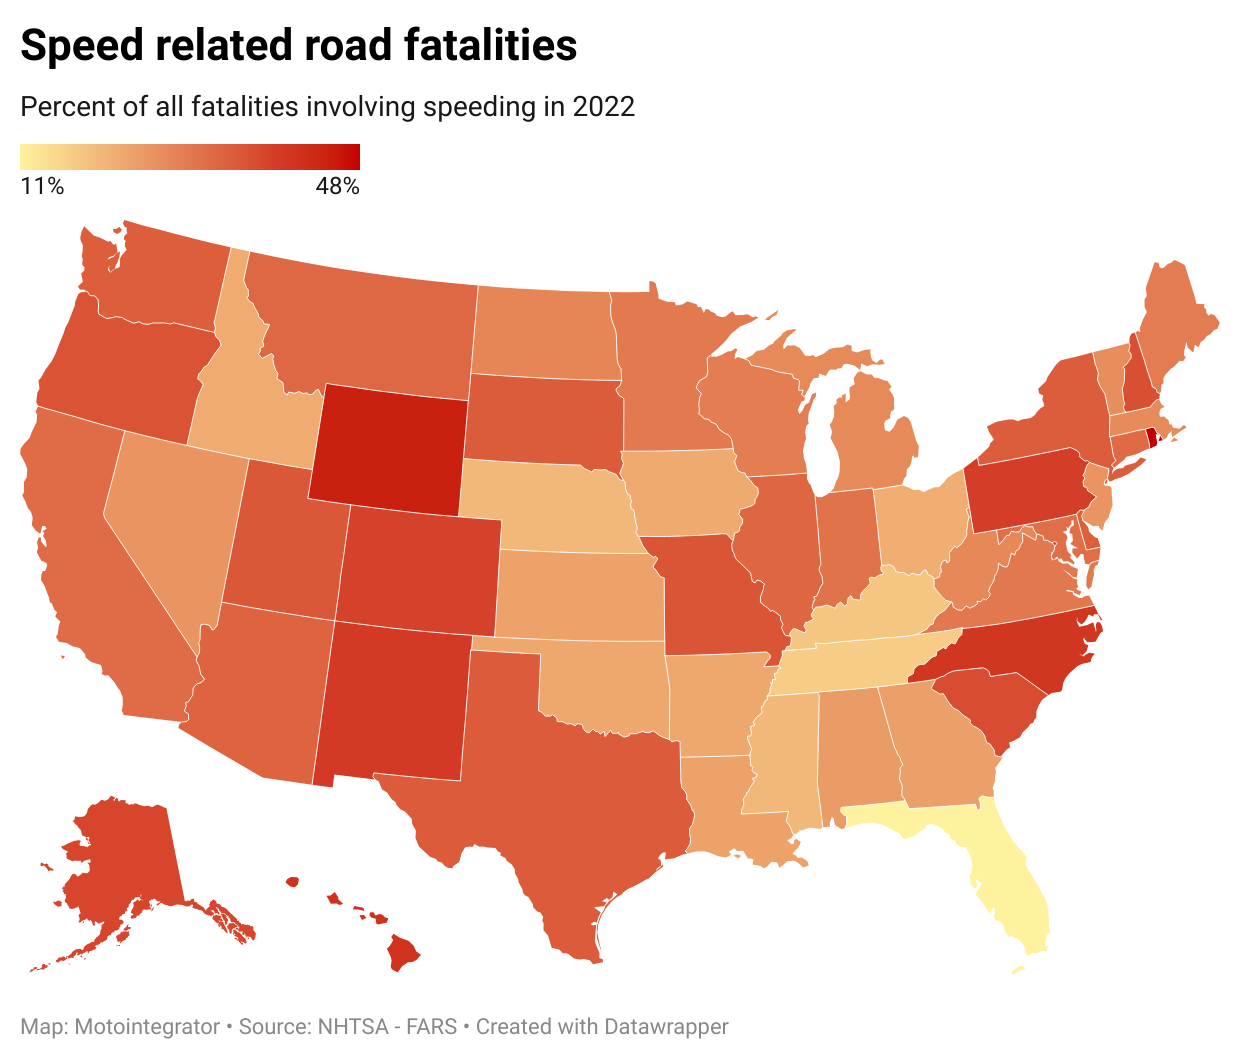
Speeding: In Rhode Island, 48.1% of road deaths involve speeding, the highest rate in the country. Wyoming (44.8%) has the second-highest speeding death rate, followed by Hawaii (41.4%).
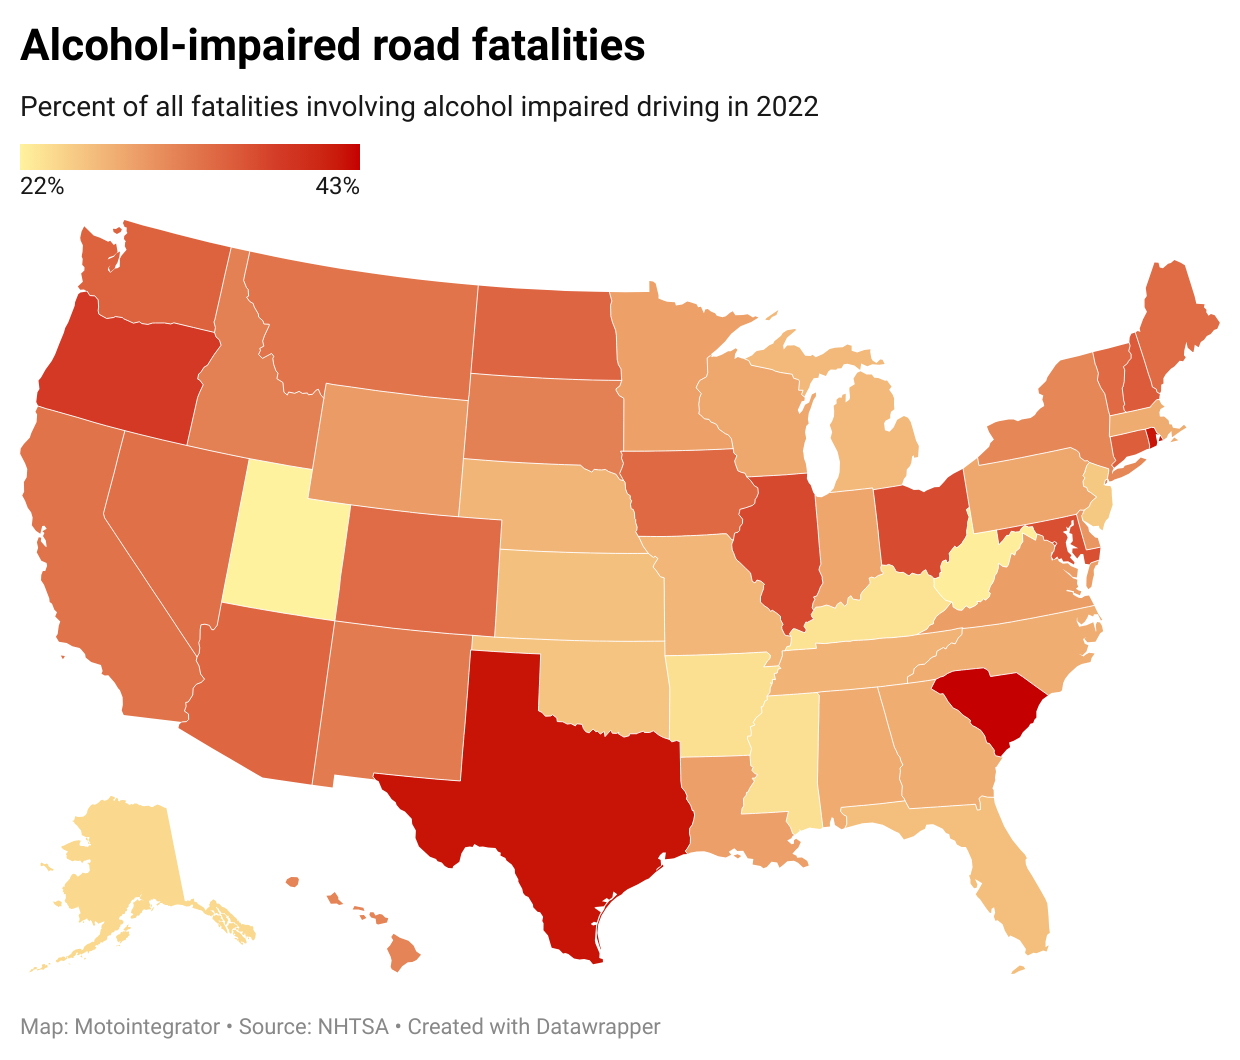
Driving under the influence of alcohol: At 43.3%, South Carolina has the highest share of road deaths that involve drunk driving. Texas (42.4%) and Rhode Island (42.3%) are close behind.
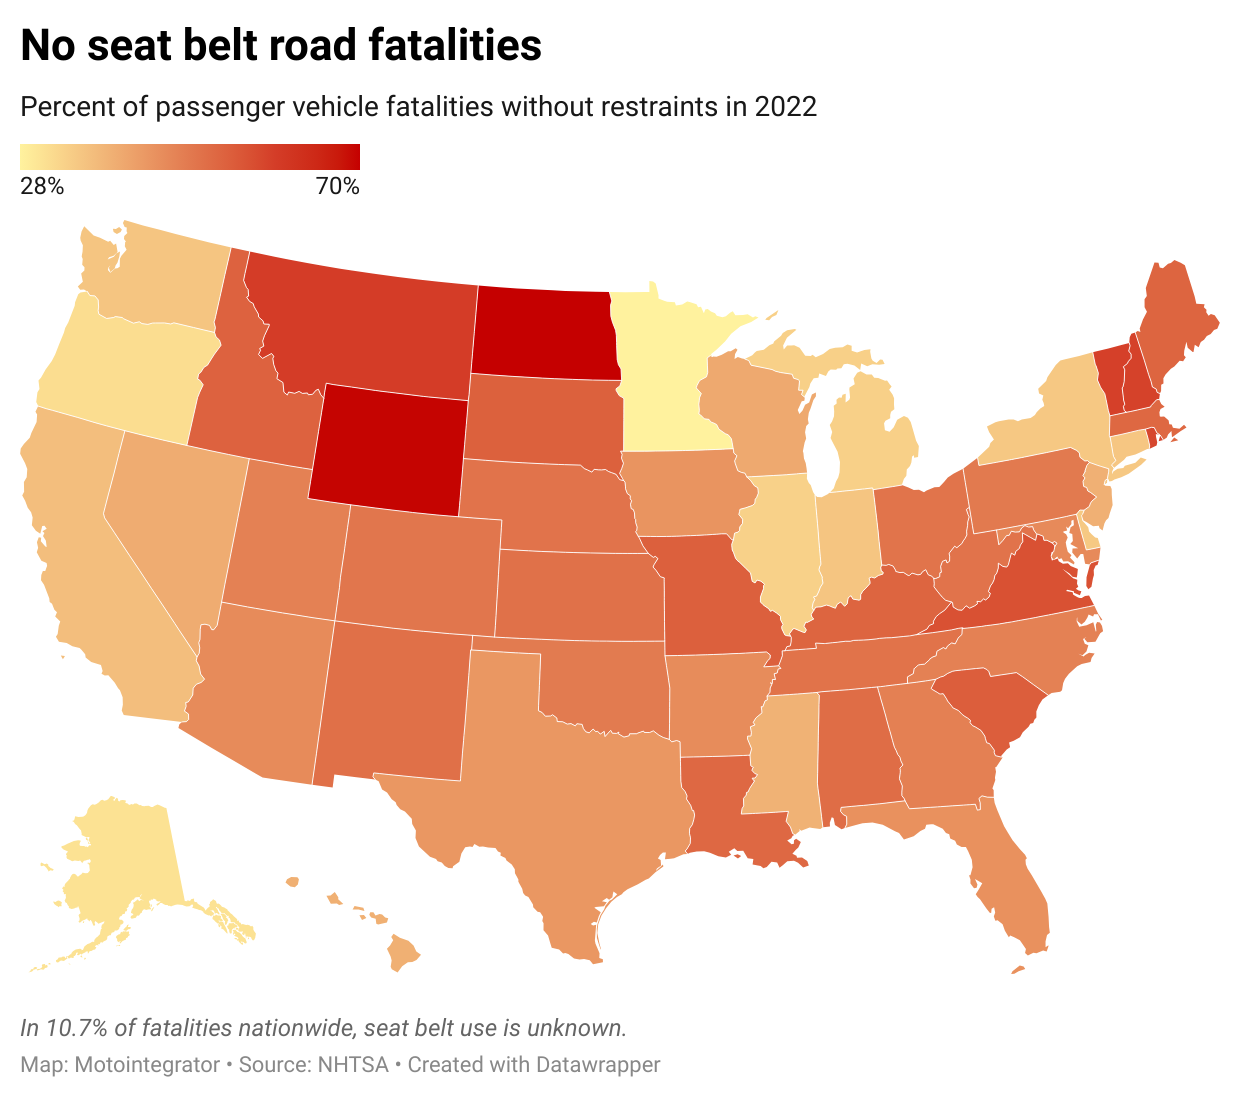
Failure to use a seat belt: Looking at vehicle occupant fatalities, North Dakota has the highest rate of deaths (69.6%) where the deceased was not wearing a restraint. Wyoming nearly matches that rate at 69.3%. Montana, which neighbors both states, has the third highest (59.4%).
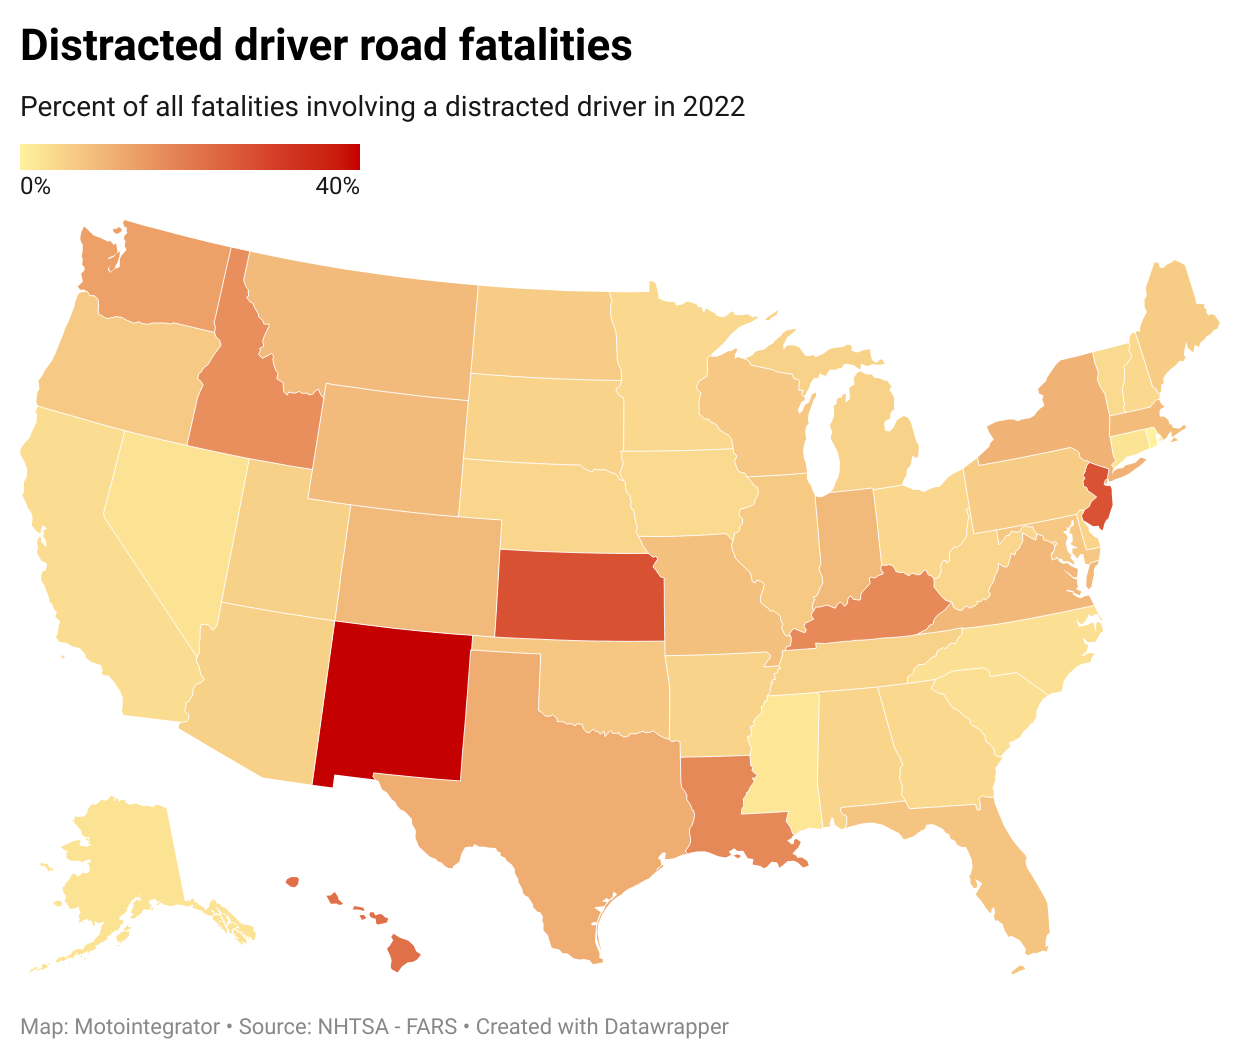
Distracted driving: New Mexico holds the highest percentage (39.7%) of road fatalities involving a distracted driver. From there, the share drops to 26.8% in Kansas and 26.7% in New Jersey.
Read on for a closer look at these findings, the important context that may explain them, and how the rest of the states stack up.
While speed limits fluctuate across different areas, the risk factor is constant: Increased speed correlates with a higher chance of fatal accidents. When the maximum state speed limit increases by just 5 mph, fatality rates on interstates and freeways increase by 8% and on other roads by 3%, according to a 2019 study from the Insurance Institute for Highway Safety.
This analysis reveals a wide range of speed-related fatalities. For instance, Florida has the lowest share of speeding fatalities, at just 11% of its 3,530 total road deaths. Meanwhile, in Texas and California, the only other states with more fatalities than Florida (4,408 and 4,428, respectively), more than 30% are related to speed.
At the highest end are states with relatively few overall fatalities. For instance, in Rhode Island, 48% of the state's 52 road fatalities are tied to speed. In Wyoming, it is 45% of the 134 fatalities. With smaller total numbers of fatalities, even a slight increase or decrease in the number of speed-related deaths can result in a significant percentage change.
It is illegal in all 50 states and Washington, D.C., to drive with a blood alcohol content, or BAC, of 0.08 g/dL or higher, except in Utah where the BAC limit is 0.05. Yet one in three deaths on U.S. roads involves a driver who flouts those limits.
While the western states have the highest regional rate of DUI deaths, there is one notable exception: In Utah, 22% of road fatalities involved a DUI, the lowest share in the country.
South Carolina has the highest DUI fatality rate; alcohol impairment is a factor in 43% of road deaths.
At any given moment, 92% of Americans in a passenger vehicle are buckled up, according to the NHTSA. That number is up from 85% in 2010. However, despite the improvement, someone dies from not wearing a seat belt every 46 minutes.
This part of the analysis focused on just fatalities among vehicle occupants — drivers and passengers of cars, SUVs, and light trucks. It is clear that wearing a seat belt pays off. Western states have the best seat belt use (96%) and collectively have the lowest share of no-restraint fatalities (41%). The southern states have the worst seat belt use (88%) and have the highest share of no-restraint fatalities (47%).
Two midwestern states bookend the country: In Minnesota, 28% of fatalities are attributed to the restraint disuse, while in North Dakota the share is 70%. However, both these states have relatively small numbers of passenger vehicle occupant deaths (283 and 56, respectively). As mentioned, in states with fewer road deaths, a small number of incidents can disproportionately affect the overall percentage.
As the map below indicates, distracted driving is not attributed to a large share of road fatalities in most states. However, the numbers may be underreported due to the difficulty in tracking distracted driving. In many cases, it is not clear whether a driver or pedestrian was distracted at the time of a crash.
After all, it is not known what the driver is going through when they crash. For all anyone knows, they could be distracted by what happened at work. Or, it could have been a particularly rough phone call or an interesting sign that caught their eye.
Even accounting for these limitations, this data can still highlight important trends and areas of concern for further investigation. For instance, New Mexico stands out as a state with a particularly high share of distracted driver fatalities, at 40%, possibly a result of the state's reporting practices.
Speeding, driving under the influence, failure to use seat belts, and distracted driving, are easily avoidable bad behaviors that unfortunately cause tens of thousands of deaths in the U.S. every year. There are many initiatives that are working to address the issue, such as Vision Zero, which aims to eliminate traffic fatalities and severe injuries through public awareness and changing road rules and behavior.
Catchy slogans like "Click it or ticket," and "Drive sober or get pulled over," help to spread the message. Meanwhile, technologies like "do not disturb" options on phones and ignition interlock devices, which require DUI offenders to pass a breathalyzer test to start their vehicle, can prevent the temptation of bad behavior.
However, there is no perfect solution. People are always going to make their own decisions, even if they know those decisions are unsafe. For instance, IIHS found that in 2020 only one in five iPhone users activated the "do not disturb" mode before driving.
The data used in this report came from the National Highway Traffic Safety Administration. For speeding fatalities and distracted driver fatalities, Motointegrator extracted 2022 state-level data from the Fatal Injury Reporting System Tool. For alcohol impairment and restraint use, the Fatal Analysis Reporting System was used.
For each state, the number of fatalities associated with the driving behavior was divided by the total number of road fatalities. For restraint use, this analysis also divided the no-restraint fatalities by the number of passenger vehicle occupant fatalities and used that ratio to create the U.S. map.
For regional analyses, the same method was used to find the percent of fatalities linked to bad driving behavior. The following definitions of geographic regions were used, as defined by the NHTSA:
Midwest: IA, KS, IL, IN, MI, MN, MO, ND, NE, OH, SD, WI
Northeast: CT, MA, ME, NH, NJ, NY, PA, RI, VT
South: AL, AR, DC, DE, FL, GA, KY, LA, MD, MS, NC, OK, SC, TN, TX, VA, WV
West: AK, AZ, CA, CO, HI, ID, MT, NM, NV, OR, UT, WA, WY
This story originally appeared on Motointegrator, was produced in collaboration with DataPulse Research, and reviewed and distributed by Stacker Media.


